Real-Time Heatmaps
In Chapter 3, you learned to find the largest all-1 rectangle in a binary matrix. You built height arrays row by row, ran the histogram algorithm on each row, and took the global maximum. Clean, O(N*M), done.
But that assumed the matrix was static. What if cells change?
You might think Chapter 8's offline sweep technique could help here — sort queries by their right endpoint, sweep the array with a stack, answer queries as you go. That works beautifully when you know all your queries upfront. But in a real-time system, you don't. The next update hasn't happened yet. You can't sort queries that don't exist. Offline techniques are useless when the data and the queries are both arriving in real time.
So we need something truly online: a system that absorbs each update as it arrives and can answer "what's the largest rectangle right now?" at any moment.
The Setup
Picture a data center monitoring dashboard. You have a grid of servers — 100 rows, 200 columns. Each cell is green (healthy, value 1) or red (down, value 0). Health checks come in continuously, flipping cells between 0 and 1. At every moment, you want to know: what's the largest rectangular block of healthy servers?
Or think about a city-builder game. The map is a grid. Players place and remove buildings. You need to find the largest empty rectangle where a new structure could fit. The grid changes with every player action.
Or consider satellite imagery. You threshold an image into a binary grid (land vs. water, forest vs. cleared). As new images arrive, pixels flip. You need the largest contiguous rectangular region matching your criteria, updated in real time.
All of these are the same problem: maximal rectangle in a dynamic binary grid.
Recap: The Static Algorithm
Let's quickly recall the Chapter 3 approach for a static grid.
- Initialize
heights[0..M-1] = 0. - For each row
i, update heights: ifgrid[i][j] == 1, thenheights[j]++; elseheights[j] = 0. - Run Largest Rectangle in Histogram on
heights. Track the global max. - Total time: O(N * M).
The height at column j after processing row i tells you: how many consecutive 1s are stacked above (and including) row i in column j?
Making It Dynamic
When a single cell grid[r][c] flips, what changes?
The height array for row r might change at column c. And that change can cascade: if grid[r][c] flips from 1 to 0, then heights[r][c] drops to 0, and every row below r that was building on top of that streak also has its height at column c reduced. If grid[r][c] flips from 0 to 1, then heights[r][c] increases, and rows below might increase too (if they also have 1s in column c).
Here's the update strategy:
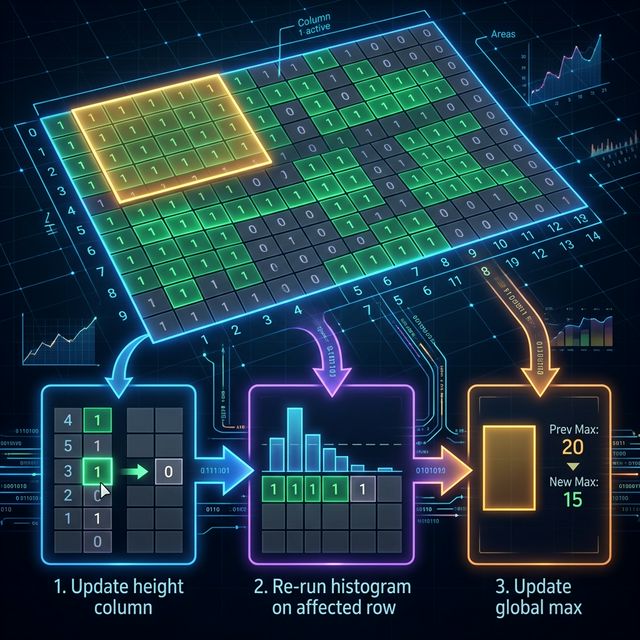
Step 1: Update the height column. Starting at row r, recompute heights[i][c] going downward. Stop early if the height at some row doesn't change — everything below it is unaffected.
for i = r to n-1:
    old = heights[i][c]
    if grid[i][c] == 1:
        heights[i][c] = (i == 0) ? 1 : heights[i-1][c] + 1
    else:
        heights[i][c] = 0
    if heights[i][c] == old:
        break  // no further changes
Step 2: Recompute the maximal rectangle. This is the expensive part. After updating the heights, you need to re-run the histogram algorithm to find the new global max. In the worst case, you re-run it on every row — O(N * M) per update.
That sounds bad. But let's put it in perspective.
Is O(N * M) Per Update Acceptable?
It depends on your grid size and update frequency.
For a 100 x 200 grid (the data center dashboard), O(N*M) = 20,000 operations per update. At a million operations per second (conservative for C++), that's 0.02ms per update. You could handle 50,000 updates per second. That's more than enough for a real-time dashboard with health checks every few seconds.
For a 1000 x 1000 grid (a game map), O(N*M) = 1,000,000 per update. Still about 1ms in C++. Fine for a game running at 60 FPS, as long as you're not processing hundreds of updates per frame.
For a 10,000 x 10,000 grid, you're at 100 million operations per update. That's around 100ms — too slow for real-time if updates are frequent.
The practical rule of thumb: for grids up to about 1000 x 1000, the brute-force recomputation is fast enough for real-time. Beyond that, you need cleverer data structures.
Optimizations That Help in Practice
Even without changing the algorithm, a few tricks speed things up.
Only re-solve affected rows. When column c's height changes from row r downward, only those rows' histogram results might change. If the height update stops propagating at row r + 3, you only need to re-solve the histograms for rows r through r + 3. Then compare with the previously stored per-row maxima for all other rows.
To do this, store rowMax[i] — the maximal rectangle area using row i as the base. After an update, recompute rowMax[i] only for the affected rows. The global max is just max(rowMax[0..n-1]).
Batch updates. If multiple cells change before you need the answer (e.g., a game processes all player actions in a frame, then queries the largest rectangle once), batch the height updates. Recompute heights for all changed columns, then re-solve the histograms once.
Lazy recomputation. If the answer is queried rarely compared to updates, don't recompute the max after every update. Just mark the grid as dirty and recompute on the next query.
Where This Pattern Appears
Game Development
City builders and RTS games face this exact problem. When a player wants to place a 3x5 building, the game needs to find all 3x5 (or larger) empty rectangles on the map. The "largest empty rectangle" algorithm gives the maximum, but with slight modifications you can enumerate all rectangles above a given size.
Games like SimCity, Factorio, and Dwarf Fortress deal with grid placement logic. While their actual implementations vary, the underlying algorithmic question is the same one you solved in Chapter 3 — now made dynamic.
Image Processing
Binary image analysis frequently needs the largest monochrome rectangle. Apply a threshold to a grayscale image: pixels above the threshold become 1, the rest become 0. Find the largest all-1 rectangle. Change the threshold? The grid updates and you need the new answer.
This comes up in document scanning (finding the largest rectangular text block), quality control (finding the largest defect-free region on a chip), and medical imaging (finding the largest uniform region in a scan).
Data Center Monitoring
We mentioned this already, but it's worth expanding. Large cloud providers operate thousands of servers arranged in racks and rows. Visualizing server health as a 2D grid is natural. Finding the largest block of healthy servers helps with workload placement — if you need to schedule a job that requires 50 machines with low-latency interconnects, you want them physically close, ideally in a contiguous rectangular block.
GIS and Satellite Imagery
Geographic Information Systems process satellite images as grids. Finding the largest rectangular region of forest, farmland, or urban area is a spatial query that maps directly to the maximal rectangle problem. As new satellite passes update pixels, the grid changes and the answer needs to be refreshed.
When the Histogram Approach Isn't Enough
For very large grids with frequent updates, O(N*M) per update is too slow. Here are the alternatives, briefly.
Segment trees on columns. Instead of recomputing the entire histogram for a row, use a segment tree that can answer "largest rectangle in histogram" queries with point updates. This brings the per-update cost down to O(N * log M) — better, but still involves touching every row.
Persistent data structures. If updates are sparse (most cells don't change between queries), you can maintain a persistent version of the height arrays and only recompute where changes occur. This is more complex to implement but can be very efficient for sparse updates.
Approximate answers. In many real-world applications, you don't need the exact largest rectangle. An approximation within 10% is fine. Sampling-based methods can give fast approximate answers for very large grids.
For this course, we'll stick with the direct approach. It's what you'd use in a system design interview, and it's practical for the grid sizes you'll encounter in most real applications.
The System Design Connection
Here's why this lesson matters beyond competitive programming.
In a system design interview, someone might ask: "Design a system that monitors a grid of servers and continuously reports the largest rectangular block of healthy servers." If you don't know the algorithmic backbone, you'll wave your hands about "scanning the grid" or "using a database query." Neither is satisfying.
But you can say: "I'd maintain a height array per row. When a server's health status changes, I update the height column in O(N) worst case. Then I re-run the Largest Rectangle in Histogram algorithm on affected rows in O(M) each. The total update cost is O(N*M) in the worst case, which handles grids up to 1000x1000 at real-time speeds."
That's a concrete, efficient answer. It shows you understand the algorithm, the complexity, and the practical limits. You can discuss when it stops scaling and what alternatives exist. That's the kind of depth that separates a strong answer from a hand-wavy one.
Try It
The starter code reads an N x M binary grid, computes the initial maximal all-1 rectangle area, then processes Q updates. Each update gives a row, column, and new value (0 or 1). After each update, print the new maximal rectangle area.
You'll need to:
- Precompute all height arrays and per-row maximal rectangle areas.
- On each update, flip the cell, recompute the height column downward from the changed row, re-solve the histogram for affected rows, and recompute the global maximum.
The "Full Real-Time Rectangle" snippet shows one way to structure this. Study it, then try writing it from scratch.
Wrapping Up the Course
This is the last lesson. Let's take a step back and see what you've built.
Chapter 1 gave you the core idea: a monotonic stack tracks dominance relationships. Elements that get eclipsed are removed and never revisited.
Chapter 2 added expiration, turning the stack into a deque that handles sliding windows.
Chapter 3 connected the stack to geometry — every array is a histogram, and boundaries give you rectangles and contribution counts.
Chapter 4 showed that the stack isn't just for querying structure but for building optimal sequences greedily.
Chapter 5 revealed the tree hiding inside the stack — the Cartesian tree, where the stack's push/pop operations implicitly construct a binary tree rooted at the minimum.
Chapter 6 pushed into optimization territory with the Convex Hull Trick, where the "monotonic" idea applies to lines and slopes, not just values.
And this chapter showed that all of these ideas work in streaming and dynamic settings. The algorithms don't need the full dataset upfront. They process elements as they arrive, maintain a compressed summary, and answer queries efficiently.
One data structure. One core principle — discard what can't matter. Seven chapters of consequences. That's the monotonic stack.
Problems
| Problem | Link | Difficulty |
|---|---|---|
| LC 901 — Online Stock Span | leetcode.com/problems/online-stock-span | Medium |
| LC 456 — 132 Pattern | leetcode.com/problems/132-pattern | Medium |
| LC 2289 — Steps to Make Array Non-decreasing | leetcode.com/problems/steps-to-make-array-non-decreasing | Medium |
| LC 975 — Odd Even Jump | leetcode.com/problems/odd-even-jump | Hard |