Queues, Batching, and Load Shedding
TL;DR
When writes arrive faster than your database can process them, you need a buffer. Queues absorb write bursts, batching amortizes per-write overhead, hierarchical aggregation reduces write volume, and load shedding drops low-priority writes to protect the system. These four techniques form a toolkit for surviving write spikes without crashing your database.
Your Database Is Not a Punching Bag
Picture this: it's Black Friday. Your e-commerce platform normally handles 5,000 orders per minute. At 12:01 AM, traffic spikes to 80,000 orders per minute. Your PostgreSQL primary can sustain maybe 15,000 writes per second on a good day.
You have two options:
- Let the database eat it — connections pile up, queries timeout, locks contend, the primary crashes, and you're on the front page of Hacker News for all the wrong reasons.
- Put a buffer in front of it — accept writes at whatever rate they arrive, process them at the rate your database can handle.
Option 2 is what this lesson is about. Four techniques, each solving a different part of the problem.
The math is brutal: 80K writes/min incoming, 15K writes/min capacity. That's a 5x gap. Without buffering, the database drowns in 30 seconds. With buffering, the excess piles up in a queue and drains over the next few minutes at a pace the database can handle. No crash. No lost writes. Just a delay.
Queue-Based Write Buffering — The Shock Absorber
The core idea is dead simple: decouple write acceptance from write processing.
Your API server validates the incoming request, drops it onto a queue, and immediately returns 202 Accepted. A separate pool of workers reads from the queue and writes to the database at whatever rate the database can sustain. The client gets an instant response. The database gets a steady, manageable stream.
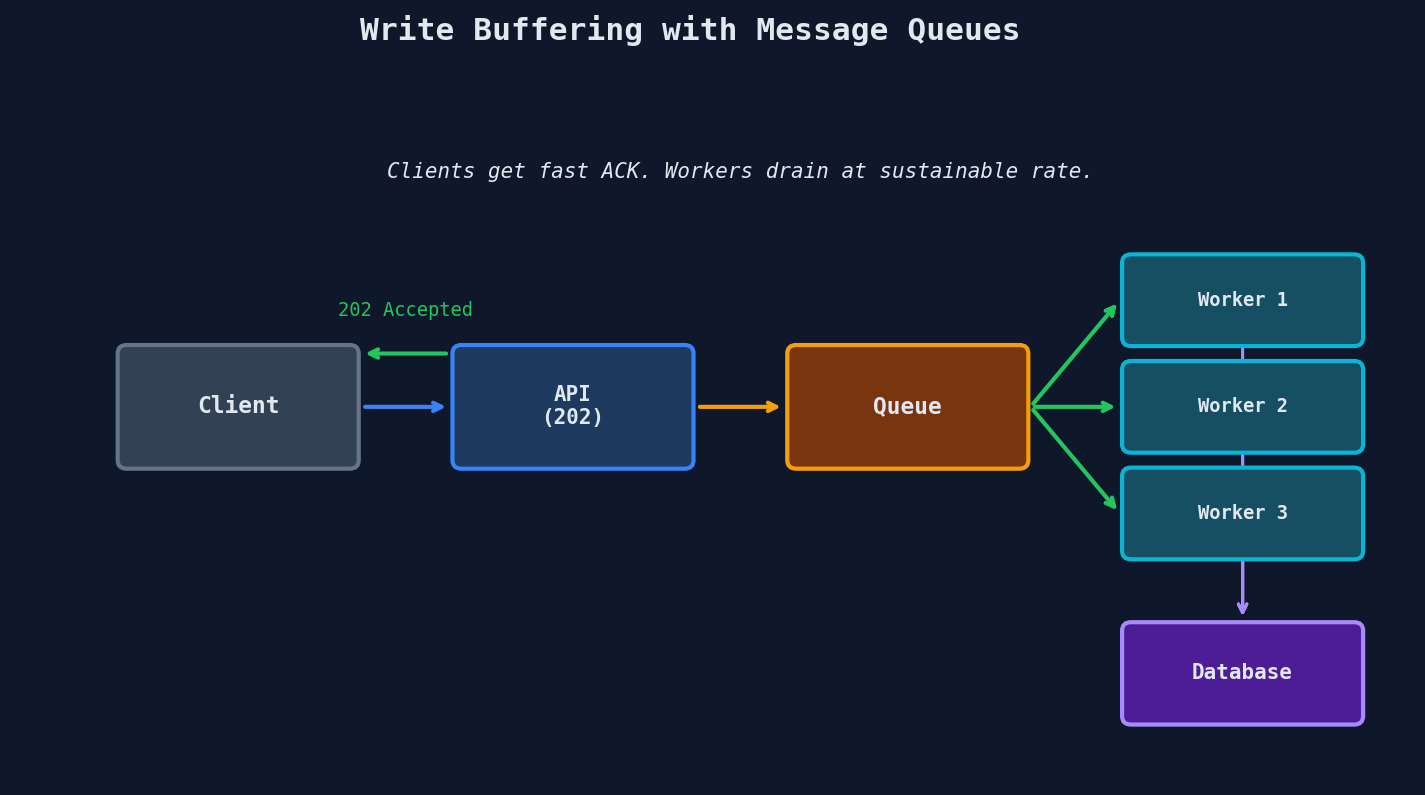
The API server's job is fast: validate the payload, serialize it, push it to the queue, return 202. No database connection needed. No waiting for locks. No fsync. The heavy lifting happens asynchronously in the worker pool.
Burst Absorption in Action
Without a queue, a traffic spike directly hammers the database:
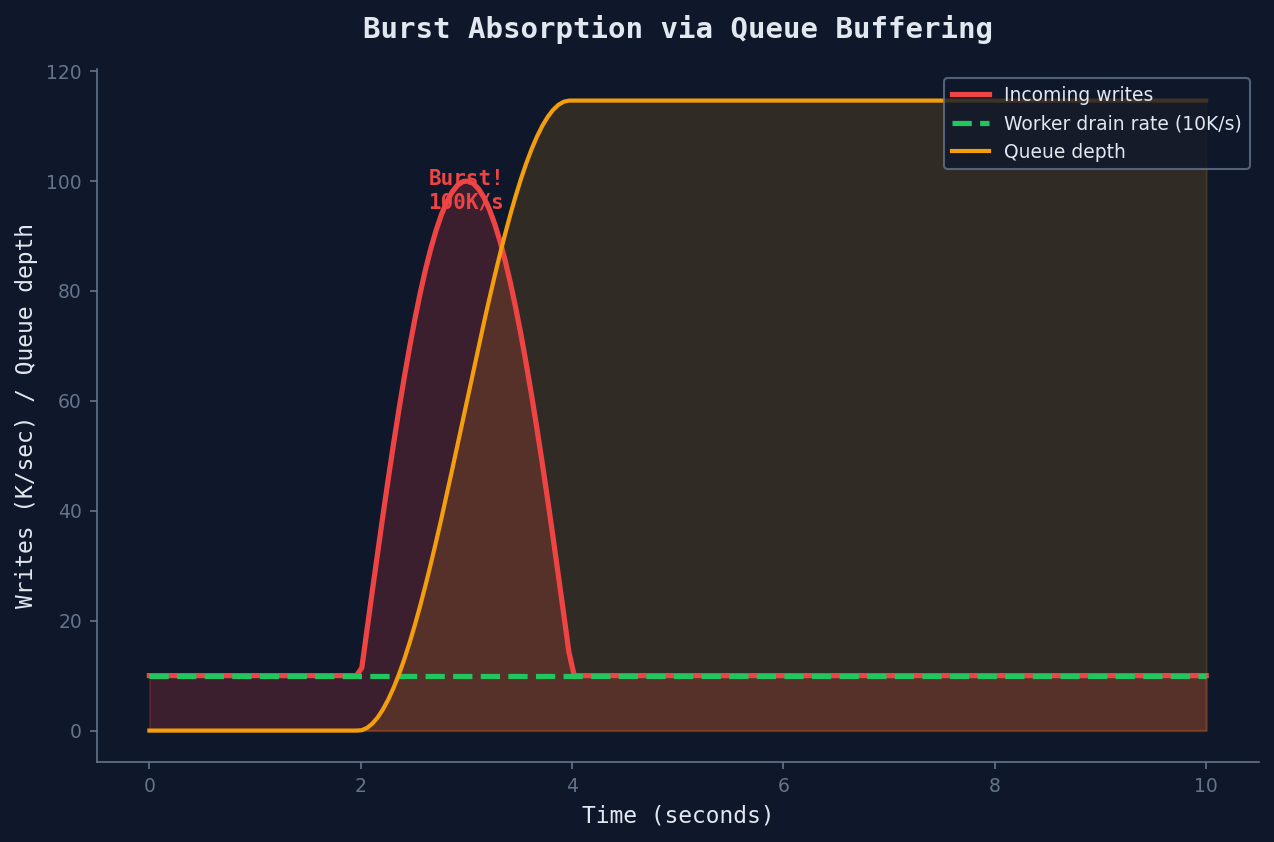
With a queue, the burst is absorbed and drained at a sustainable rate:
The queue grew to ~900K messages during the burst (90K/sec surplus x 10 seconds), then drained over the next ~90 seconds. The database never saw more than 10K writes/sec. No crash. No dropped writes. Just a delay.
The 202 Contract
When your API returns 202 Accepted, you're making a specific promise to the client: "I received your request and will process it later." This is fundamentally different from 200 OK, which means "your request is done."
@app.route("/api/orders", methods=["POST"])
def create_order():
    # Validate immediately — reject garbage before it hits the queue
    order = validate_order(request.json)
    if not order:
        return {"error": "Invalid order payload"}, 400

    # Enqueue for async processing
    message_id = queue.send_message(
        queue_url=ORDER_QUEUE,
        body=json.dumps(order),
    )

    # Return immediately — order is NOT in the DB yet
    return {
        "status": "accepted",
        "message_id": message_id,
        "poll_url": f"/api/orders/status/{message_id}"
    }, 202
The client can poll poll_url to check if the order was successfully processed. Or you can push a notification via WebSocket. Either way, the write is eventually consistent — the API said "accepted," not "done."
The Trade-Off
Queue-based buffering makes writes eventually consistent. Your API returns "accepted" before the data hits the database. If a user creates an order and immediately refreshes the page, they might not see it yet. Design your frontend to handle this — show a "processing" state, not a blank page.
Batching — Amortizing the Per-Write Tax
Every individual write to a database carries overhead that has nothing to do with the actual data:
Per-Write Overhead (paid for EVERY individual INSERT):
──────────────────────────────────────────────────────
1. Network round-trip:        Client → DB → Client
2. Connection checkout:       Grab a connection from the pool
3. Query parsing:             Parse SQL text into execution plan
4. Transaction management:    BEGIN, acquire locks
5. WAL entry:                 Write to the Write-Ahead Log
6. Index updates:             Update every index on the table
7. Constraint checking:       FK, uniqueness, NOT NULL
8. fsync:                     Flush WAL to disk
9. Transaction commit:        Release locks, COMMIT
10. Connection return:        Return connection to pool
For a single INSERT, this overhead might take 0.5ms. The actual data write? Maybe 0.01ms. You're paying 50x overhead for every individual row.
Batching amortizes that overhead across N writes. Pay the tax once, insert N rows.
-- Individual inserts (slow): 1000 round trips, 1000 fsyncs
INSERT INTO events (user_id, action) VALUES (1, 'click');
INSERT INTO events (user_id, action) VALUES (2, 'view');
INSERT INTO events (user_id, action) VALUES (3, 'click');
-- ... 997 more statements

-- Batched insert (fast): 1 round trip, 1 fsync
INSERT INTO events (user_id, action) VALUES
  (1, 'click'),
  (2, 'view'),
  (3, 'click'),
  -- ... 997 more rows in the same statement
  (1000, 'scroll');
The difference is dramatic:
| Batch Size | Round Trips | fsyncs | Throughput (rows/sec) | Latency per Row |
|---|---|---|---|---|
| 1 (no batching) | 1,000 | 1,000 | ~2,000 | ~0.5 ms |
| 10 | 100 | 100 | ~15,000 | ~0.7 ms |
| 100 | 10 | 10 | ~80,000 | ~1.2 ms |
| 1,000 | 1 | 1 | ~150,000 | ~6.5 ms |
| 10,000 | 1 | 1 | ~200,000 | ~50 ms |
That's a 75-100x throughput improvement from batch size 1 to batch size 1,000. But notice the latency column — each individual row waits longer because it's sitting in a buffer until the batch fills up.
How Kafka Does Batching
Kafka's producer is a masterclass in batching. Two knobs control when a batch is flushed:
batch.size(bytes) — flush when the batch reaches this sizelinger.ms(time) — flush after this many milliseconds, even if the batch isn't full
Kafka Producer Batching
────────────────────────────────────────────────
                         ┌─ batch.size reached? ──→ FLUSH
Messages arrive → Buffer ─┤
                         └─ linger.ms elapsed?  ──→ FLUSH

Whichever threshold is hit first triggers the flush.
With batch.size=16384 (16 KB) and linger.ms=5:
- Under high load: batches fill to 16 KB quickly, flush before 5ms
- Under low load: batches flush every 5ms regardless of size, keeping latency bounded
This two-knob design gives you a single tuning surface to trade latency against throughput. Low linger.ms = lower latency, smaller batches. High linger.ms = higher throughput, bigger batches.
Interview Tip
Batching is the single most impactful optimization for write-heavy systems. If an interviewer asks how to improve write throughput, batching should be your first answer — before sharding, before switching databases, before anything exotic. It's free throughput from reducing overhead.
Hierarchical Aggregation — Writing Less, Not Faster
Batching makes writes faster. But what if you could make fewer writes entirely?
Hierarchical aggregation reduces write volume by aggregating data at multiple levels before it hits the database. Instead of writing every raw event, you aggregate locally, merge regionally, and write a summary globally.
The View Counter Problem
Consider counting video views. A popular video gets 10 million views per minute. If you write each view as an individual database row:
10,000,000 views/min ÷ 60 sec = ~167,000 writes/sec

PostgreSQL single-node capacity: ~15,000 writes/sec

Result: 💥 Database is dead 11x over.
Even with batching, you're looking at 167K rows per second hitting one counter. The problem isn't write overhead per row — it's contention on a single counter. Every write needs to UPDATE videos SET view_count = view_count + 1 WHERE id = ?, which acquires a row-level lock. At 167K/sec, those locks contend so badly the database grinds to a halt.
Three-Tier Aggregation
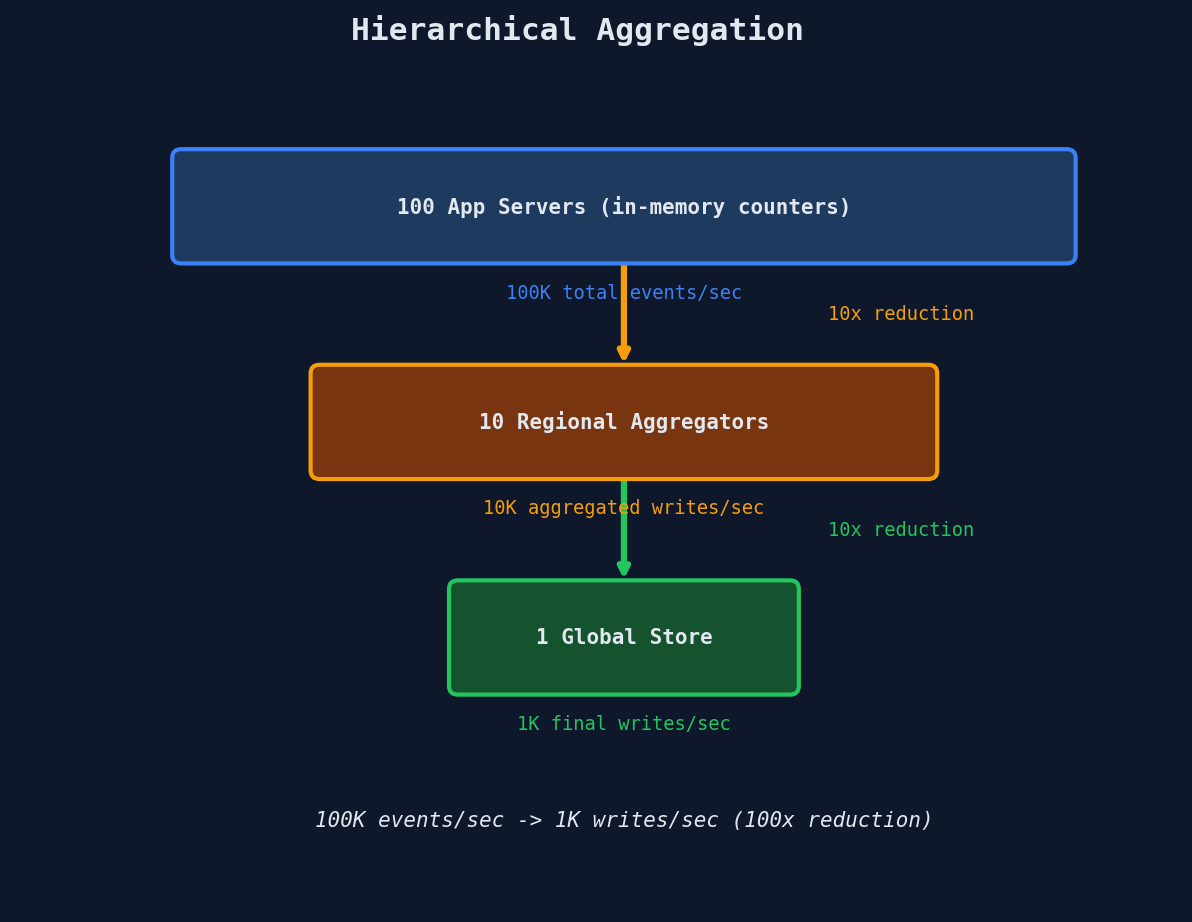
Instead of writing every view to the database, aggregate at three levels:
Watch the write reduction cascade:
Tier 1: 10M views/min across 100 app servers
        Each server counts locally in memory
        100 servers × 1 flush every 5 seconds = 20 writes/sec to Tier 2

Tier 2: 4 regional aggregators receive ~5 writes/sec each
        Each aggregator sums and flushes every 10 seconds
        4 aggregators × 1 flush every 10 seconds = 0.4 writes/sec to Tier 3

Tier 3: Database receives ~0.4 writes/sec

Write reduction: 167,000 writes/sec → 0.4 writes/sec
                 That's a 400,000x reduction.
The In-Memory Counter
The Tier 1 logic is straightforward — accumulate in memory, flush periodically:
import threading
import time

class AggregatingCounter:
    def __init__(self, flush_interval_sec=5):
        self._counts = {}          # video_id → local count
        self._lock = threading.Lock()
        self._flush_interval = flush_interval_sec
        self._start_flush_thread()

    def increment(self, video_id):
        """Called on every view — fast, no I/O."""
        with self._lock:
            self._counts[video_id] = self._counts.get(video_id, 0) + 1

    def _flush(self):
        """Periodically send accumulated counts to the regional aggregator."""
        while True:
            time.sleep(self._flush_interval)
            with self._lock:
                batch = self._counts.copy()
                self._counts.clear()

            if batch:
                # One network call with all accumulated counts
                regional_aggregator.submit(batch)
                # e.g., {"video_abc": 4821, "video_xyz": 1203}

    def _start_flush_thread(self):
        t = threading.Thread(target=self._flush, daemon=True)
        t.start()
Each increment() call is a dictionary update in memory — microseconds, no I/O, no locks beyond a lightweight in-process mutex. The flush thread wakes up every 5 seconds and ships the batch. If the app server crashes between flushes, you lose at most 5 seconds of counts. For view counters, that's perfectly acceptable.
YouTube uses a similar pattern for view counts — the number you see on a video is slightly delayed (typically 5-30 seconds behind real-time), but the system can handle billions of views per day without melting the database.
When Approximate Is Good Enough
The displayed count is approximate for a few seconds. But consider what you've gained:
| Approach | Writes/sec to DB | Accuracy | Contention |
|---|---|---|---|
| Direct writes | 167,000 | Exact, real-time | Extreme (row-level lock storm) |
| Batched writes | ~1,670 (batch of 100) | Exact, delayed | High |
| Hierarchical aggregation | ~0.4 | Approximate, ~15s delay | None |
For view counts, likes, page views, and metrics — approximate is good enough. Nobody cares if a video shows 10,000,042 views vs 10,000,089 views. They care that the number is in the right ballpark and the system is alive.
Not For Everything
Hierarchical aggregation works for commutative, idempotent operations — things you can sum, count, or merge without ordering concerns. It does NOT work for operations where exact ordering matters (message delivery) or where losing a few events is unacceptable (financial transactions).
Load Shedding — When You Can't Process Everything
Queues absorb bursts. Batching reduces overhead. Aggregation reduces volume. But what happens when even those techniques aren't enough? When your queue is growing faster than you can drain it, and the system is heading toward collapse?
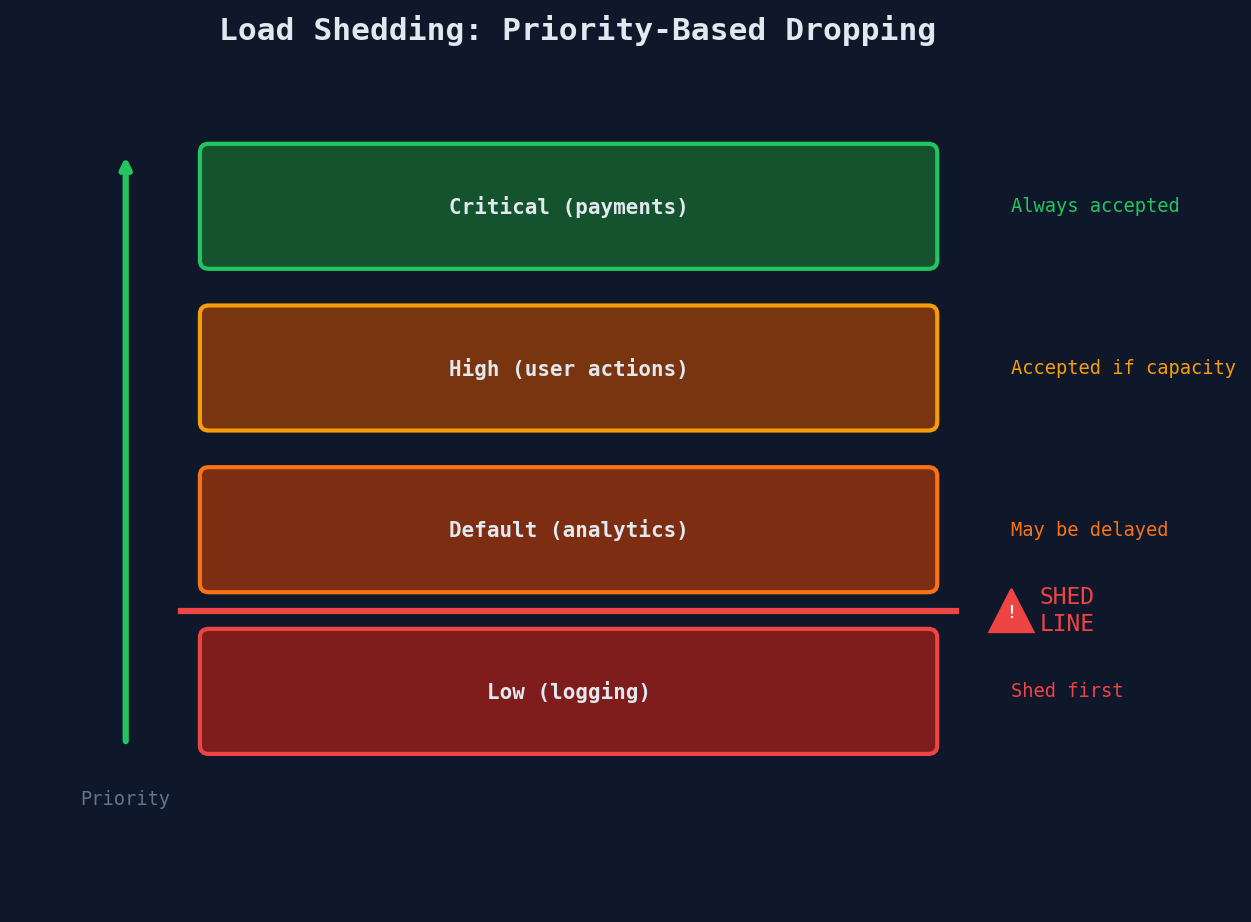
You shed load. You intentionally drop low-priority work to keep the critical path alive.
This feels wrong at first. Dropping requests? On purpose? But the alternative is worse: an uncontrolled crash that drops ALL requests, including the critical ones. Load shedding is controlled failure. A crash is uncontrolled failure.
Priority Queues — Not All Writes Are Equal
The first step is admitting that not all writes have the same business value. A payment confirmation is worth infinitely more than an analytics event.
Priority Tiers:
──────────────────────────────────────────────────────────
CRITICAL │ Payment confirmations, account creation
         │ → Never shed. If these fail, the business fails.
─────────┤
HIGH     │ Order processing, inventory updates
         │ → Shed only under extreme duress.
─────────┤
DEFAULT  │ User activity (likes, comments, follows)
         │ → Shed when queue depth exceeds threshold.
─────────┤
LOW      │ Analytics events, recommendation signals, logs
         │ → First to shed. Rebuild from event replay later.
──────────────────────────────────────────────────────────
When your system is healthy, all tiers get processed. When load exceeds capacity, you start shedding from the bottom:
QUEUE_DEPTH_THRESHOLDS = {
    "low":      5_000,    # Shed LOW when queue > 5K
    "default":  20_000,   # Shed DEFAULT when queue > 20K
    "high":     100_000,  # Shed HIGH when queue > 100K
    "critical": None,     # NEVER shed critical
}

def should_accept(priority: str, current_queue_depth: int) -> bool:
    threshold = QUEUE_DEPTH_THRESHOLDS.get(priority)
    if threshold is None:
        return True  # Critical — always accept
    return current_queue_depth < threshold

@app.route("/api/events", methods=["POST"])
def ingest_event():
    event = request.json
    priority = classify_priority(event)
    queue_depth = queue.get_depth()

    if not should_accept(priority, queue_depth):
        return {
            "error": "Service overloaded",
            "priority": priority,
            "retry_after": 30
        }, 503  # Service Unavailable

    queue.send(event, priority=priority)
    return {"status": "accepted"}, 202
Backpressure — Tell Producers to Slow Down
Load shedding drops requests after they arrive. Backpressure stops them from arriving in the first place. It's the difference between a bouncer turning people away at the door vs. removing the door entirely.
Backpressure works at two levels:
TCP-level backpressure happens automatically. When your server stops reading from the socket, the OS receive buffer fills up. The sender's TCP window shrinks to zero. The sender physically cannot transmit more data. This is built into the protocol — you get it for free.
TCP Backpressure (automatic):
──────────────────────────────────────────────────────────
Sender buffer: [msg][msg][msg][msg][FULL]  ← can't send more
                         ↕ TCP window = 0
Receiver buffer: [msg][msg][msg][msg][FULL] ← not being read
                         ↓
                  Server too busy to read() from socket
Application-level backpressure is explicit. Your API returns 429 Too Many Requests with a Retry-After header, telling the client exactly when to come back:
@app.route("/api/ingest", methods=["POST"])
def ingest():
    if system_is_overloaded():
        return {
            "error": "Too many requests"
        }, 429, {"Retry-After": "30"}

    # Process normally
    queue.send(request.json)
    return {"status": "accepted"}, 202
Well-behaved clients honor the Retry-After header and back off. Badly behaved clients get rate-limited at the load balancer. Either way, the system is protected.
The Key Insight
It's better to drop analytics events than crash your payment system.
A system that sheds 20% of analytics traffic during a spike is healthy. A system that crashes under load and takes payments, orders, and analytics down together is a catastrophe.
Design your priority tiers before you need them. During an outage is not the time to debate whether likes are more important than orders.
Last Resort, Not First Instinct
Load shedding is a last resort. But it's far better than an uncontrolled crash. Design your priority tiers BEFORE you need them. Classify every write in your system by business criticality. When the queue starts growing unbounded, you'll know exactly what to drop and what to protect.
When to Use Which
These four techniques aren't mutually exclusive. Most production systems combine several of them:
| Technique | Solves | Trade-off | Best For |
|---|---|---|---|
| Queue buffering | Write bursts exceeding DB capacity | Eventual consistency — API returns "accepted," not "done" | Bursty traffic patterns (flash sales, viral events) |
| Batching | Per-write overhead (round trips, fsyncs, parse) | Higher latency per individual write (waits for batch) | High-throughput inserts (logs, events, metrics) |
| Hierarchical aggregation | Too many writes to the same counter/row | Approximate counts, delayed visibility | View counts, likes, analytics, monitoring |
| Load shedding | System survival under extreme, sustained load | Some low-priority writes are intentionally lost | Protecting critical writes (payments, orders) |
A Real Architecture: All Four Together
A production event ingestion pipeline might combine all four:
- Backpressure at the load balancer keeps total inbound traffic bounded
- Load shedding drops low-priority events when queues are deep
- Queue buffering absorbs bursts across priority tiers
- Batching in the worker pool reduces per-write overhead to the database
- Hierarchical aggregation for counters and metrics reduces write volume
Each layer protects the one below it. The database — the slowest, most precious component — sees a smooth, sustainable write stream regardless of what's happening at the edge.
Quick Recap
| Concept | Key Takeaway |
|---|---|
| Queue buffering | Decouple acceptance from processing. Return 202, drain at DB speed. |
| Batching | Amortize per-write overhead. 100x throughput gain from batching 1,000 rows. |
| Hierarchical aggregation | Aggregate locally, merge regionally, write globally. 400,000x write reduction. |
| Load shedding | Drop low-priority writes to protect critical ones. Controlled > uncontrolled failure. |
| Backpressure | Signal producers to slow down (TCP or 429). Stop the flood at the source. |
| Priority tiers | Classify every write by business value BEFORE the crisis. |
| Combined architecture | Layer all four techniques. Each layer protects the one below it. |
Interview Tip
Interviewers love asking "what happens during a traffic spike?" Queue buffering + load shedding is the answer. Show that you can gracefully degrade instead of catastrophically fail. Walk them through the layers: backpressure limits inbound traffic, priority queues classify writes, load shedding drops the least important ones, batching maximizes throughput for what remains, and the database sees a steady, sustainable stream. That's the answer of someone who's operated systems under real load.