The Read Bottleneck
TL;DR
Most real-world applications are overwhelmingly read-heavy — social media feeds fire 100+ database queries for every single page load, while writes are rare in comparison. A single database server has hard physical limits on how many reads it can serve, and no amount of clever code can fix that. Understanding where and why databases break under read load is the first step to designing systems that scale.
Open Instagram. Count the Queries.
You tap the Instagram icon. Your feed loads. Feels instant. But behind the scenes, your phone just triggered a small earthquake of database activity.
For every single post in your feed, the backend needs:
- The image URL and metadata (1 query)
- The author's username and profile photo (1 query)
- The like count (1 query)
- Whether you liked it (1 query)
- The top 2-3 comment previews (1 query)
- The commenter usernames (1 query per commenter)
Multiply that across 20-30 posts in your initial feed load, and you're looking at 100+ read operations hitting the database. Every time. For every user. Simultaneously.
Now think about how often you write to Instagram. Maybe one photo a day? One comment? A handful of likes?
| Action | DB Operations |
|---|---|
| Open feed | 100+ reads |
| Scroll more | 100+ reads |
| View a profile | 30+ reads |
| Check explore page | 80+ reads |
| Post a photo | 1 write |
| Leave a comment | 1 write |
| Like 10 posts | 10 writes |
| TOTAL | ~310 reads, ~12 writes |
That's roughly a 25:1 read-to-write ratio — and that's just one user having a calm day. The actual platform-wide ratio is far higher.
Read-to-Write Ratios — The Numbers That Shape Architecture
Not all applications are equally read-heavy, but almost all of them lean that way. Here's a rough spectrum:
| Application Type | Read:Write Ratio | Example |
|---|---|---|
| Internal CRUD tool | 3:1 | Admin dashboard, back-office app |
| Basic web app | 10:1 | E-commerce product catalog |
| Social media | 100:1 | Instagram, Twitter/X, Reddit |
| CDN-backed content | 1000:1 | News sites, documentation, streaming catalogs |
Why do reads grow faster than writes? Because readers outnumber writers by orders of magnitude. On Twitter, millions of people read a viral tweet. One person wrote it. On YouTube, a video gets 10 million views. It was uploaded once.
As your user base grows, the number of people consuming content grows linearly (or faster), while the number of people creating content grows much slower. This isn't a bug in your system — it's a fundamental property of how humans use the internet.
Common Mistake
Don't assume your application is "balanced" between reads and writes. Measure it. Even applications that feel write-heavy (like a chat app) are usually read-heavy — every message is written once but read by every participant in the conversation.
The Physics Problem — Why You Can't Just "Optimize the Code"
Here's where it gets uncomfortable. Your database runs on a physical machine, and that machine has hard ceilings.
Hardware Limits of a Single Database Server
┌─────────────────────┬──────────────────────────────┐
│ Resource            │ Ceiling                      │
├─────────────────────┼──────────────────────────────┤
│ CPU cores           │ 64-128 cores (high-end)      │
│ RAM                 │ 256-512 GB (typical prod)    │
│ Disk I/O (SSD)      │ ~500K-1M IOPS               │
│ Disk I/O (spinning) │ ~150-200 IOPS               │
│ Network             │ 10-25 Gbps                   │
└─────────────────────┴──────────────────────────────┘
A well-tuned single PostgreSQL instance on good hardware handles roughly 5,000-20,000 queries per second. MySQL is in a similar range. That sounds like a lot — until you do the math.
The Math That Breaks Your Database
Let's say you're building a social media app. You have 1 million registered users. Each feed load triggers 100 read queries.
1,000,000 users
×       1% concurrent (online right now)
=  10,000 active users

10,000 active users
×    100 queries per feed load
= 1,000,000 queries

If a feed loads in 2 seconds:
1,000,000 queries ÷ 2 seconds = 500,000 queries/second
Your PostgreSQL instance handles 20K queries/second on a good day. You need 500K. You're off by 25x.
And 1% concurrent users is conservative. During peak hours — a major event, a viral moment — that number spikes to 5-10%.
Now you're off by 125x. This isn't a slow query you can optimize with a better index. This is a physics problem. You literally do not have enough hardware to serve the reads from a single machine.
Interview Tip
When you see numbers like these in an interview, do the back-of-envelope math out loud. Interviewers love seeing you calculate QPS (queries per second) because it shows you understand why you need a particular architecture, not just what the architecture is.
Where Databases Actually Break
It's not that the database suddenly explodes. It degrades. Slowly at first, then all at once. Here are the four failure modes, in the order you'll usually hit them:
1. Connection Pool Exhaustion
PostgreSQL defaults to 100 max connections. Each active query holds a connection. When all 100 are in use, new requests queue up and wait. If the queue grows faster than connections free up — timeouts. Errors. Users see blank screens.
                    ┌─────────────────────┐
  Request 1 ───────►│                     │
  Request 2 ───────►│   Connection Pool   │
  Request 3 ───────►│   (100 slots)       │
      ...          │                     │
  Request 100 ─────►│   ALL FULL          │
                    └─────────────────────┘
  Request 101 ─────► 🚫 WAITING...
  Request 102 ─────► 🚫 WAITING...
  Request 103 ─────► 🚫 TIMEOUT → ERROR
You can increase the pool size, but each connection consumes RAM (~10 MB in PostgreSQL). 1,000 connections = 10 GB of RAM just for connection overhead.
2. CPU Saturation
Complex queries — especially those with multiple JOINs, subqueries, or aggregations — burn CPU. When every core is pegged at 100%, queries start queuing behind each other. Response times climb from milliseconds to seconds.
3. Disk I/O Bottleneck
When the database needs data that isn't cached in RAM, it reads from disk. SSDs handle ~500K random reads per second. Spinning disks? About 200. If your queries consistently need data that's not in memory, disk becomes the bottleneck long before CPU does.
4. Memory Pressure
Every database keeps frequently-accessed data in a memory cache (PostgreSQL calls it shared_buffers). When your working set — the data your queries actually touch — exceeds available RAM, the database constantly evicts cached pages and reads them back from disk. Performance falls off a cliff.
Here's the full picture of a single-database architecture under stress:
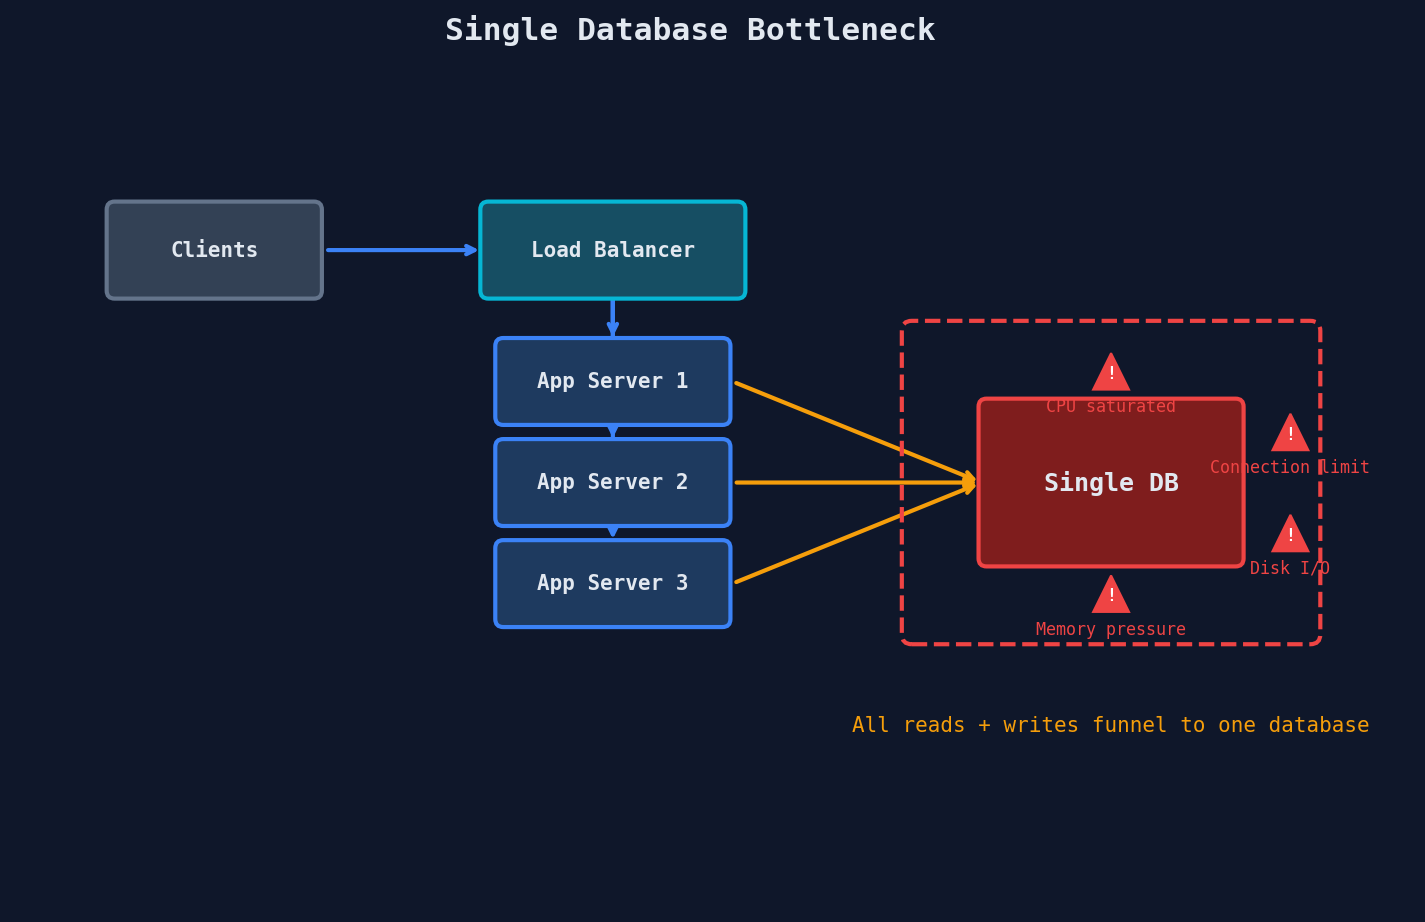
Notice the problem: you can add as many app servers as you want behind the load balancer. They're stateless — scaling them is easy. But every single one funnels reads through the same database. The database is the single point of failure and the single point of saturation.
The Scaling Ladder — A Roadmap for This Chapter
There's no single magic fix. Instead, you climb a ladder of increasingly powerful (and increasingly complex) solutions. Each rung handles more load but introduces new trade-offs.
                        Load Handled
                        ──────────►

  ┌──────────────────────────────────────────────┐
  │  Step 6: CDN / Edge Caching                  │  Millions of req/s
  │  Push static + semi-static content to edge   │
  ├──────────────────────────────────────────────┤
  │  Step 5: Distributed Cache (Redis Cluster)   │  Hundreds of thousands
  │  Cache across multiple nodes                 │
  ├──────────────────────────────────────────────┤
  │  Step 4: Application-Level Caching           │  Tens of thousands
  │  Redis/Memcached in front of the DB          │
  ├──────────────────────────────────────────────┤
  │  Step 3: Read Replicas                       │  3-5x more reads
  │  Copy the DB, spread reads across copies     │
  ├──────────────────────────────────────────────┤
  │  Step 2: Query + Index Optimization          │  2-10x per query
  │  Better indexes, denormalization, query fixes│
  ├──────────────────────────────────────────────┤
  │  Step 1: Single Database (you are here)      │  5K-20K queries/s
  │  PostgreSQL / MySQL on one machine           │
  └──────────────────────────────────────────────┘
In the next few lessons, we'll climb this ladder one step at a time:
| Lesson | Step | What You'll Learn |
|---|---|---|
| Lesson 2 | Query + Index Optimization | Squeeze more out of your existing DB before adding complexity |
| Lesson 3 | Read Replicas | Split reads across multiple database copies |
| Lessons 4-5 | Caching Layers | Put Redis/Memcached between your app and DB |
| Lesson 6 | CDN + Edge Caching | Push content to servers physically closer to users |
Each step is a tool in your toolbox. You don't always need all of them — but you need to know when to reach for each one.
Proof Points — This Isn't Theory
The biggest companies in the world have fought this exact battle:
Instagram serves 100+ queries per feed load across billions of daily active users. Their entire backend architecture evolved around solving the read bottleneck.
Netflix built EVCache, a distributed caching layer that handles 30+ million requests per second. Without it, their database infrastructure would need to be orders of magnitude larger.
Facebook created TAO, a read-optimized distributed data store that achieves a 99.9% cache hit rate on over 10 billion daily read requests. Only 0.1% of reads actually touch the underlying database.
These aren't theoretical numbers. They're the result of years of engineering to solve the exact problem we just outlined: reads overwhelm writes, and a single database can't keep up.
Quick Recap
| Concept | Key Takeaway |
|---|---|
| Read-to-write ratio | Most apps are 10:1 to 1000:1 reads-to-writes |
| Single DB limits | ~5K-20K queries/sec on good hardware |
| Connection pool | Default 100 connections, each costs ~10 MB RAM |
| The real problem | You can scale app servers easily, but the database is the bottleneck |
| Scaling ladder | Indexes → Replicas → Cache → CDN, each step adds complexity |
Interview Tip
When an interviewer describes a system, listen for read-heavy signals: "users browse a catalog," "millions of followers see each post," "customers search products." These are your cues to immediately think about caching layers, read replicas, and CDNs. If you jump straight to "let's add a cache" without first explaining why — the read-to-write ratio and the single-DB bottleneck — you'll miss the chance to show real understanding.